How fast can Buffett sell his stock portfolio down to zero holding?
Up to 1 year, generally. Regarding AAPL, Buffett and tsterm.com arrived at similar holding today, under comparable trading speed.
tsterm.com: as configured with 6 months trading horizon.
In the last post, we explained how to find Buffett’s 13F filing of his portfolio’s holdings. The latest one for 2024 Q4 is at https://www.sec.gov/Archives/edgar/data/1067983/000095012325002701/xslForm13F_X02/39042.xml.
The Formula
In order to compute how fast Buffett can sell out all the holding of one stock, we use the formula
total holding of one stock / (average trading volume per day over the United States * 10%)
Why the percentage “10%”? It is an assumption on how many trades Buffett participates in relative to the trading volume of that stock over the nation. “100%” would be unrealistic — if only Buffett wants to sell, all the bidders can bid infinitely low to “squeeze” him from this certainty.
We can find out Buffett’s total holding of one stock from the 13F filing. How to find out the daily trading volume (averaged over a period, likely one month)? Yahoo Finance has it. Locate any stock, read out the “Avg. Volume” in terms of shares.
For example, about American Express https://finance.yahoo.com/quote/AXP/,
There is a last note before we list the results. The “Avg. Volume” shown on Yahoo Finance tallies the trading volume on Exchanges, as Nasdaq, New York Stock Exchange (NYSE), etc. There are bilateral trades (called “over-the-counter” trades) with no supervision of an exchange, or trades conducted on alternative platforms, so more trading volume outside the exchanges. FINRA is the official source of those statistics.
With American Express AXP as example again, we find the off-exchange (over-the-counter) volume is very roughly one half of national volume on a given day, https://chartexchange.com/symbol/nyse-axp/exchange-volume/. That is true for the four largest holdings of Buffett: American Express AXP, Bank of America BAC, Apple AAPL, Coca-Cola KO.
So, the formula we are going to use is
total holding of one stock / (average on-exchange trading volume * 2 * 10%)
The Results
Based on the 2024 Q4 13F filing,
AXP total holding 151,610,700 shares, avg on-exchange volume 2,944,485 shares per day, 151,610,700 / (2,944,485 * 2 * 0.1) = 257 business days, about 1 year;
BAC total holding 680,233,587 shares, avg on-exchange volume 40,103,286 shares per day, 680,233,587 / (40,103,286 * 2 * 0.1) = 84 business days, about 4 months;
AAPL total holding 300,000,000 shares, avg on-exchange volume 53,399,049 shares per day, 300,000,000 / (53,399,049 * 2 * 0.1) = 28 business days, about 1 month and a half;
KO total holding 400,000,000 shares, avg on-exchange volume 18,424,685 shares per day, 400,000,000 / (18,424,685 * 2 * 0.1) = 108 business days, about 5 months.
Note news that Buffett holds today 30% of the once maximum holding of AAPL. His maximum holding would have taken about 28 / 30% = 93 business days, or about 4.4 months, to sell out.
What’s the Relation with tsterm.com?
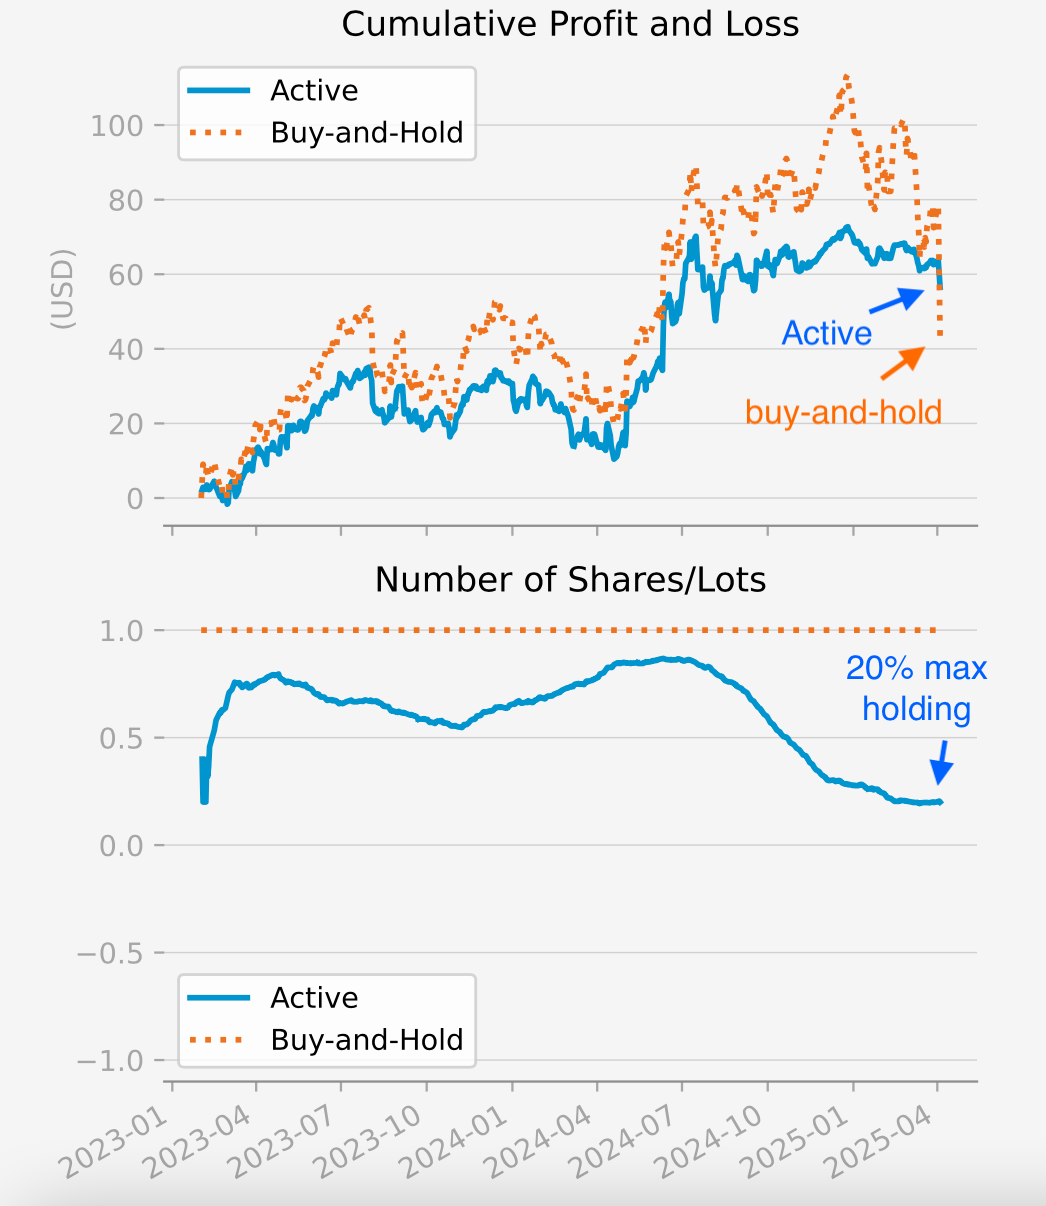
The engine behind tsterm.com is generic, can be parameterised with any forecast horizon. What we are seeing is being configured with 6 months forecast horizon. As the daily position is the average of signals computed over the most recent 6 months, it entails that to go from fully long a maximum size (in number of shares) to fully short the size would take 6 months. To go from fully long the maximum size to zero holding would take half of that, ie 3 months, comparable to Buffett’s timeframe till selling out AAPL from the maximum holding.
On tsterm.com, the AAPL computed daily position started shaving off about one quarter before the November 2024, and steadily even at times AAPL price jumped up when NVDA crashed in 2025. The active strategy’s Sharpe ratio (of daily return to volatility of daily return) is 0.93, higher than the passive buy-and-hold strategy 0.42. The Sharpe ratio is one measure for the trade-off between return and risk.
As of Fri 4 Apr, the position for the next day Mon 7 Apr is 20% maximum size. From the “Next-Day Position” section, one may work out
20% (“up” votes) - 0% (“down” votes) = 20%.
Further Notes on Over-the-Counter Trades
A Look at Over-the-Counter Equities Trading https://syndication.finra.org/content/look-over-counter-equities-trading
Over-the-Counter Per Issue data, “per issue” is “per stock” https://otctransparency.finra.org/otctransparency/OtcIssueData Choose “OTCE” for “Over-the-Counter Equities”.
Support tsterm.com
Would you like predictions for BTCUSD, TSLA.US, etc., and intra-day update for more real-time experience? Support tsterm.com with $5 a month.


