History of US national (federal) debt and how they relate to trade imbalance
They are not directly related but have a common component. Let’s dive in.
How does the US national (federal) debt relate to the federal government deficit?
When the tax revenue does not cover the federal government expense at one year, the deficient part is called the deficit. When deficit arises, the Department of the Treasury issues US Treasury debt to borrow money.
The national deficit is associated with the fiscal year. The national debt, on the other hand, measures the cumulative deficit so far.
https://fiscaldata.treasury.gov/americas-finance-guide/national-deficit/
US federal debt vs deficit (cumulated since 1901)
To fund the Medicare, Social Security, trust funds were established as reserves holding US Treasury debts. The Treasuries in those trust funds cannot be transacted over public markets and called “non-marketable”. The Treasuries that can change hands are called “marketable”.
On the FRED (Federal Reserve Economic Data) website, one can find the data series:
federal debt (marketable & non-marketable) https://fred.stlouisfed.org/series/GFDEBTN/
federal debt (marketable) https://fred.stlouisfed.org/series/FYGFDPUN/
federal deficit since 1901 https://fred.stlouisfed.org/series/FYFSD/
As of Q4 2024,
federal debt (non-marketable) 7.4 trillion USD
federal debt (marketable) 28.8 trillion USD
total 36.2 trillion USD
We compute the cumulative sum of federal deficit since 1901, and plot the series together with the federal debt levels:
We can see the cumulated federal deficit (since 1901) generally tracks well the marketable federal debt. The non-marketable federal debt began to widen since 80s. It is possible it did not get accounted as federal deficit then.
Holders of US federal debt (marketable)
The marketable federal debt is held by three types of entities: US Federal Reserve banks, domestic investors, and foreign investors.
US federal debt held by Federal Reserve banks https://fred.stlouisfed.org/series/FDHBFRBN/
US federal debt held by foreign investors https://fred.stlouisfed.org/series/FDHBFIN/
Below is the stacked area plot. As of Q4 2024,
held by federal reserve bank 4.6 trillion USD
held by foreign investors 8.5 trillion USD
held by domestic investors 15.7 trillion USD
total marketable federal debt 28.8 trillion USD
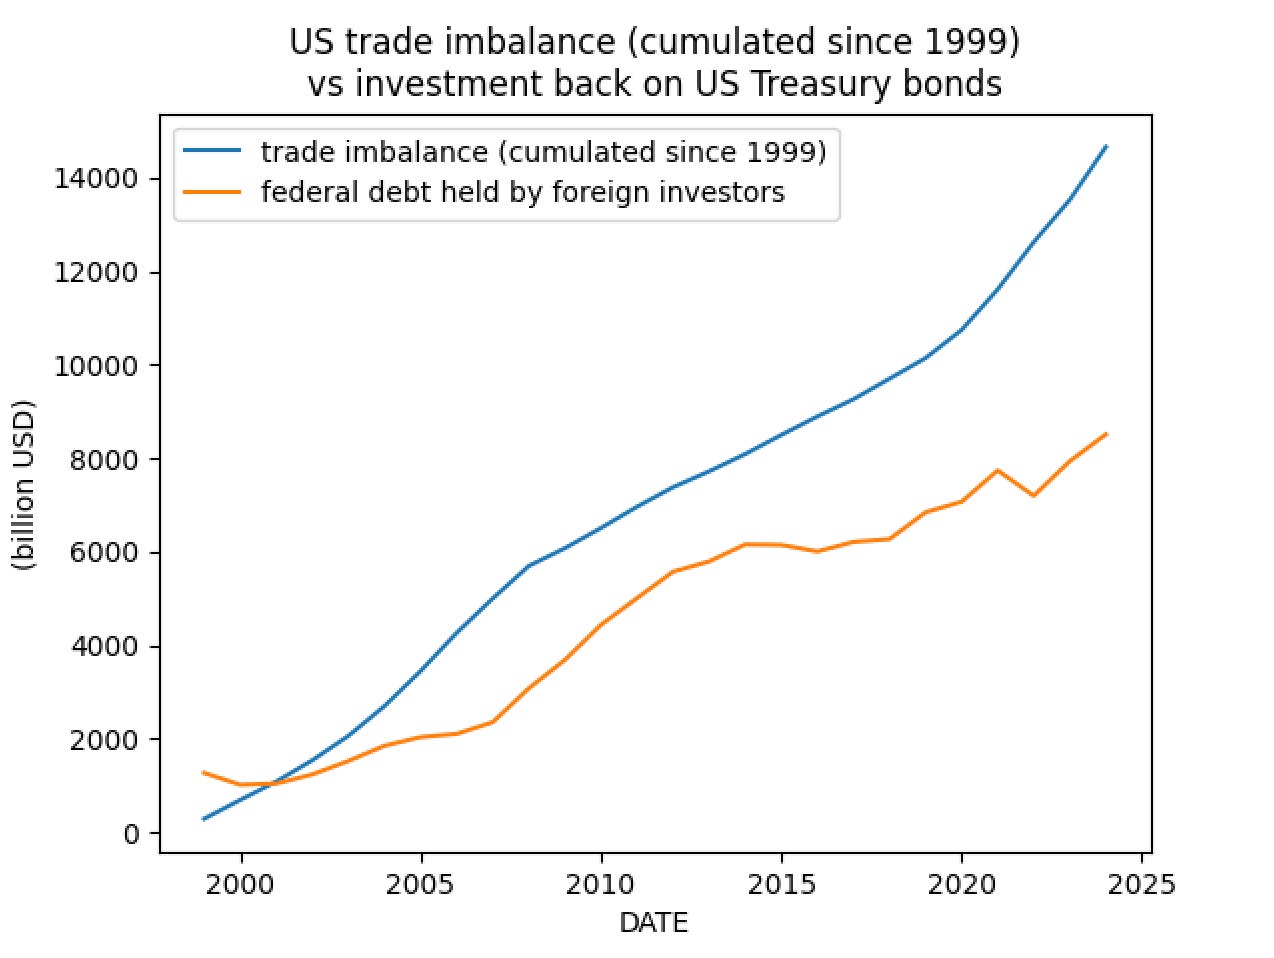
Wait, have we talked about “trade imbalance”?
The imbalance of goods trade is recorded under “current account” in macroeconomics.
Balance on current account since 1999 https://fred.stlouisfed.org/series/IEABCN
As “national deficit”, the “balance on current account” is attached to particular period. In order to compare with the cumulative quantity “federal debt held by foreign investors”, we need to cumulate them since 1999 the availability date. The actual cumulated “trade imbalance” can be larger including pre-1999 history.
The US Treasuries are not the only investment target. Foreign investors can choose to invest the dollars made from trade on, for example, US stocks. We see below there is indeed a gap.
How did we download data and do the plotting?
We used Python’s package pandas_datareader. For more information, contact us. You could find the contact detail from Brief Solutions Ltd brief-ds.com.
References
What is the national deficit? https://fiscaldata.treasury.gov/americas-finance-guide/national-deficit/
About Social Security https://www.ssa.gov/about-ssa
Medicare financing https://en.wikipedia.org/wiki/Medicare_(United_States)#Financing
Who holds US national debt? https://fredblog.stlouisfed.org/2025/03/who-holds-us-national-debt/


