


JPMorgan JPM: tsterm.com computed daily position starts shaving off since October 2024, realising higher Sharpe ratio (return-to-risk ratio)
The daily position stayed stable until October 2024 (one month before US General Election) when it started shaving off.
The distribution of price on the day 6 months away is constantly being predicted, from the computed driving factors.
Sharpe Ratio of the Active Strategy
Sharpe ratio (return-to-risk ratio, the higher the better):
Active 1.21 Passive buy-and-hold 0.95
The cumulative return can be increased if the daily position profile is multiplied by a constant. That won’t change the return-to-risk characteristics.

After the Election the JPM stock price enjoyed a good rally supported by Trump’s banker-friendly appointments and policy pledge. Going into January 2025, the stock price underwent sharp correction, and the Sharpe ratio of the active strategy became sharply higher.
Why the computed daily position started dropping circa the US Election?
Let’s check the causal predictors (driving factors) computed around then for JPM’s price in 6 months, for example, as of 2024-11-01.
Add “&asof=2024-11-01” to the web address so it becomes:
https://tsterm.com/?q=jpm&asof=2024-11-01

No. 1 Marriott is an international hotel chain, so could be a symbol to discretionary spending inflation, which just experienced a correction. If the consumer inflation collapses, JPM being a big deposit-holding bank, will go down as well;
No. 2 ASML is one of the only vendors of semiconductor manufacturing equipment. It is a fundamental player in the production chain of AI chips. It had started dropping since July 2024.

As the US stock market is highly efficient in incorporating information of all sorts, Trump’s winning odd and his advocated policies at the beginning of November 2024 may have fed into the stock prices (of the causal predictors computed for JPM).
The prediction signal (percentage of “up” votes minus percentage of “down” votes) for the day in 6 months’ time got weaker and weaker. The daily position, being the average of the signals computed each day over the most recent 6 months, dropped steadily. For more detail on how simulated trading is done, refer to the white paper.
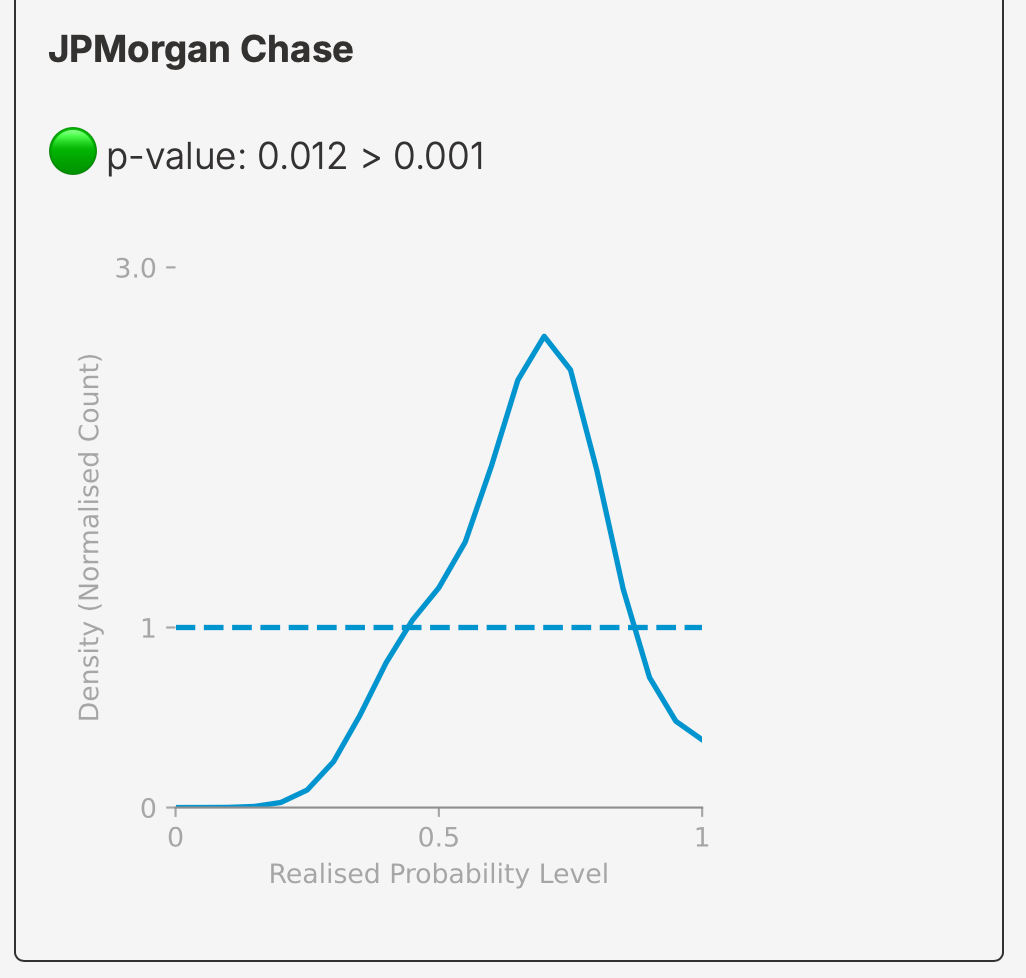
How trustable are the computed driving factors and predictions based on them?
On the page
expand on the box “Goodness of Probabilistic Prediction”. On a sample of dates, if the p-value is over 0.001, the goodness is acceptable. It could be that the p-value fluctuates above or below 0.001 depending on the sample of dates for the test.
Support tsterm.com
Would you like predictions for BTCUSD, TSLA.US, etc., and intra-day update for more real-time experience? Support tsterm.com with $5 a month.