


Gold vs Nasdaq 100 vs S&P 500. US stocks driven by tariff threat. Global assets driven by US payroll. Iran and neighbouring countries inflation rates.
As supply chain is perturbed, in order to maintain the same profitability, American businesses may resort to laying off employees.
Under still high US Treasury interest rates, the pressure on business profitability is on, or investors will just invest on the Treasury bonds.
Gold vs Nasdaq 100 vs S&P 500
Since 1/11/2024 (US Election month), appreciation
Gold (GLD ETF). 18%
Nasdaq 100. 13%
S&P 500. 6%
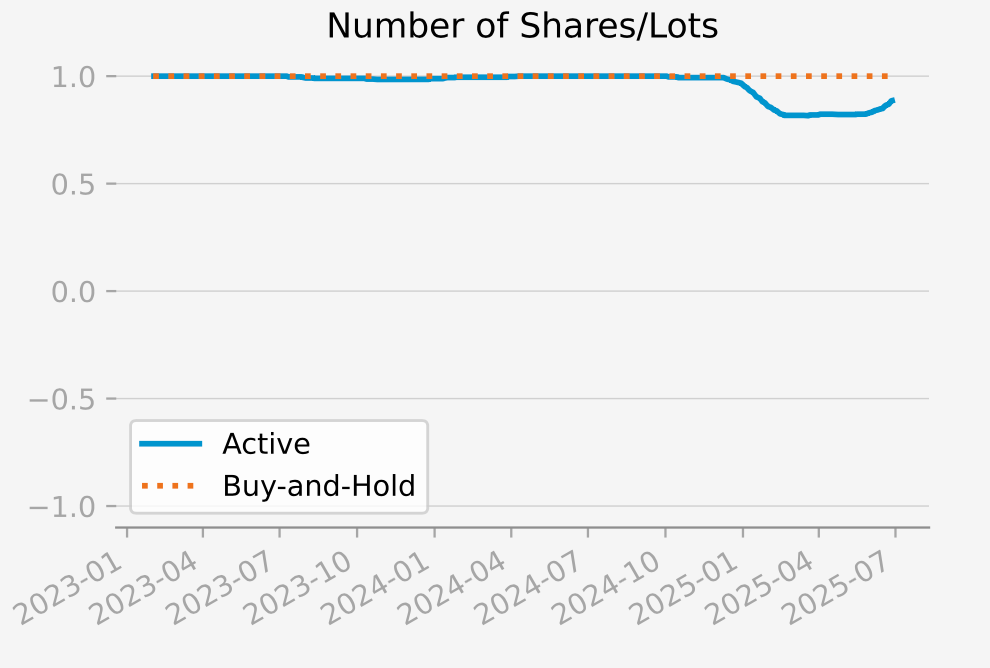
Now we look at the computed daily positions by tsterm.com (from “signals” from the 6-month ahead probabilistic predictions):
Gold ETF GLD: since November 2024, as stocks embodying high inflation crashed (as drivers for gold), the daily position shaved off from 100% for the first time, shielding from later price volatility in 2025. But recently it is back up, as Gold hovers around 3,300 USD/ounce level. The active strategy has achieved the same Sharpe ratio as the passive strategy (return to volatility of return).
Nasdaq 100 ETF QQQ: computed daily position more optimistic than for S&P 500 ETF SPY. Under high interest rates pressure, innovative (high margin) businesses may stand a better chance.

S&P 500 ETF SPY:

US stocks driven by tariff threat
Copart CPRT engages in the used car auction business. The day the tariff on new auto parts went into effect, CPRT floated up to be No. 1 driving factor for the three US stock indices. Its price is now lower than on the 3 May effective date of the tariff (on auto parts), which may be interpreted as tempered tariff threat.
Today, CPRT is still No. 1 driving factor for the three US stock indices:

Global assets driven by US payroll
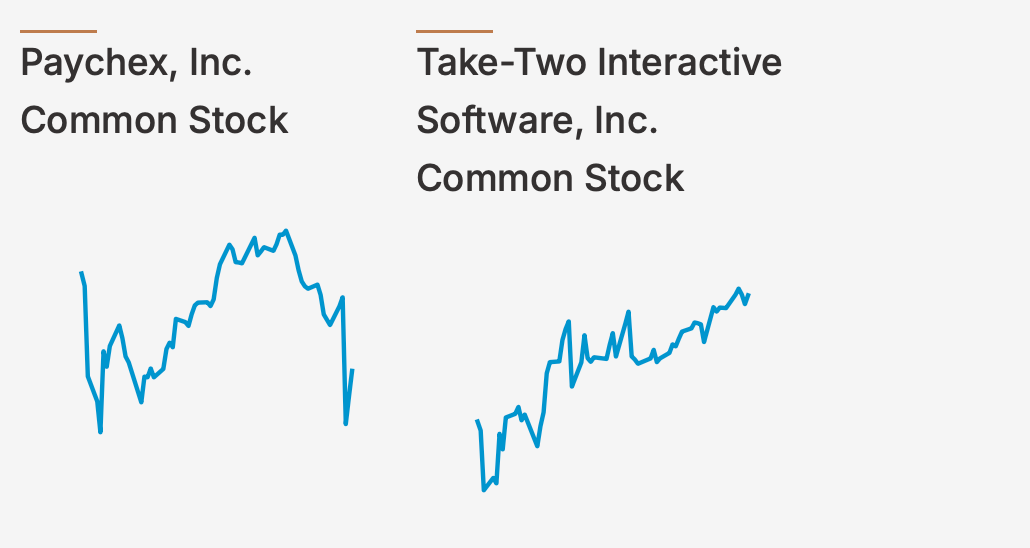
As the US economy is uniquely driven by consumption, its consumption power may influence global assets (equity, foreign exchange, fixed income, etc). Today Paychex PAYX, a payroll processing company is computed as No. 1 driving factor of all assets (for the day in 6 months) on the homepage of tsterm.com:
Iran and neighbouring countries inflation rates
One may search for “tradingeconomics <country_name> inflation rate” to find the latest readings of annual inflation rates from tradingeconomics.com:
Iran. 38.7%
Iraq. 1.5%
Turkey. 35.4%
Serbia. 3.8%
Bulgaria. 3.7%
Romania. 5.4%
Hungary. 4.4%
Poland. 4.1%
(United States. 2.4%)
So from Asia to Central Europe, the annual inflation rate is around 4-5%.
Support tsterm.com
If you like the Time Series Terminal, support tsterm.com with $5 a month.