Amid July 2024 slip: Nasdaq 100 vs S&P 500
tsterm.com expects the July 2024 market slip to affect less S&P 500 than Nasdaq 100.
The US markets began to slip since the mid July. Over past ONE month by Friday 26 July return:
Nasdaq 100. -2.48%
S&P 500 +0.24%
Note S&P 500 managed to break even over past ONE month. Nasdaq 100 dipped.
Nasdaq 100
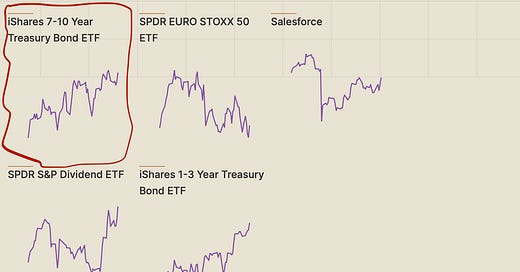
If one searches for “Nasdaq 100” or its ETF ticker “QQQ” on tsterm.com, its No 1 predictor is computed as the US 7-10 Year Bonds ETF IEF (under 6 months forecast horizon, updated as of Sunday 28 July). The US 10 Year treasury interest rate decreased since months so its bond price increased (ref: inverse relation of interest rate vs bond price)
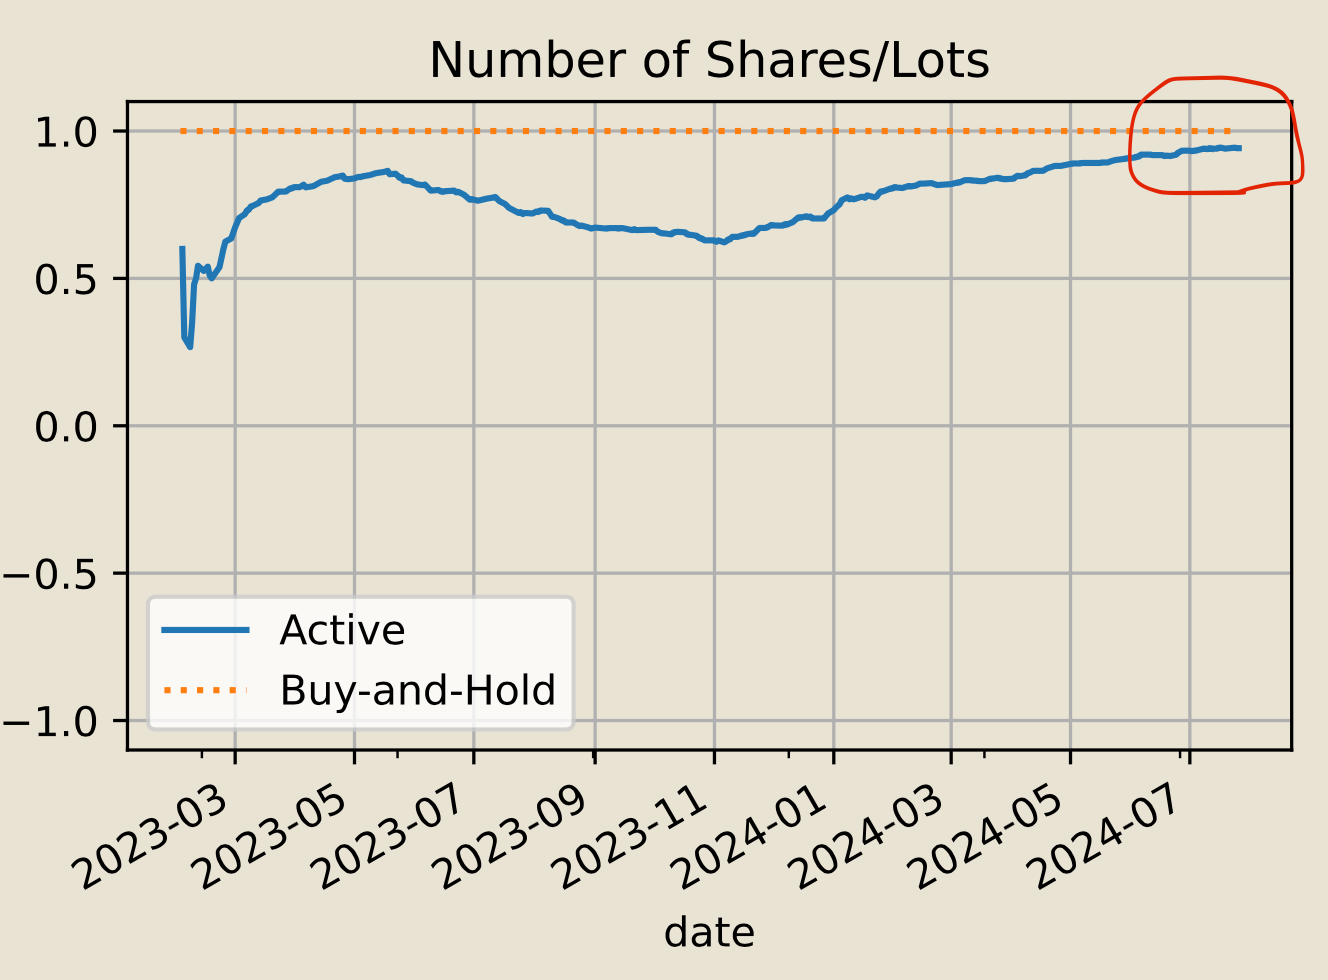
The S&P 500 ETF QQQ’s computed daily position started to dip since early June 2024. Actually many tech stocks as AAPL, NVDA’s computed daily positions shared similar behaviour: they started to flatten or dip since June or July 2024, well before the actual market dip in mid July.
Over one year live running records, the Sharpe ratio (the higher the better) of the active simulated trading strategy was 1.72, vs 1.68 for the passive buy-and-hold strategy, assuming zero trading cost.
So tsterm.com seems of opinion at the moment that when the US long-term interest rate decreases, making the corresponding bond price increase, money flows into the long-term bonds (for better certainty), it does not forebode well for innovative technology stocks’ prices six months away (the forecast horizon).
S&P 500
If one searches for “S&P 500” or its ETF ticker “SPY” on tsterm.com, among the computed top five causal predictors are mainly pharmaceuticals and industrials (outside technology):
Note in contrast to Nasdaq 100, the S&P 500 index holds a mix of technology (electronic/software/Internet/AI/semiconductor), biotechnology and blue-chip stocks. Over past ONE month, the three “driver” stocks all went up:
AMGN +6.3%
DD +0.98%
INCY +11.60%
Correspondingly, the computed daily position of SPY has always been up:
Over one year live running records, the Sharpe ratio (the higher the better) of the active simulated trading strategy was 1.74, vs 1.63 for the passive buy-and-hold strategy, assuming zero trading cost.
So tsterm.com is expecting the current market slip to affect less the S&P 500 index. One may check again in six months’ time. :)


