24-Month Review of Prediction Performance
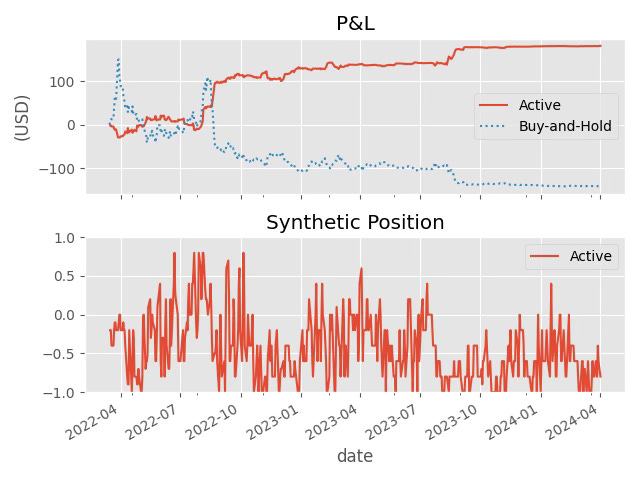
tsterm.com was online about two years ago. Let’s review the performance of prediction performance by doing a on-paper trading backtest.
Using 2-day forecast period
and input data of daily granularity,
assuming zero trading cost,
using the net prediction as the on-paper trading position (i.e. "23% of models predict up in net” would translate to “long 0.23 shares”),
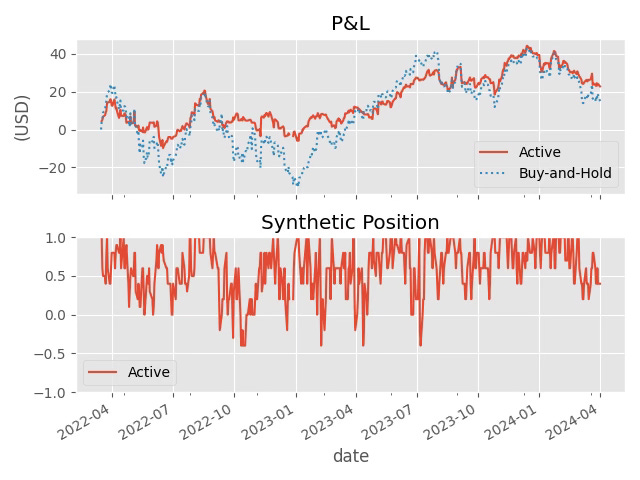
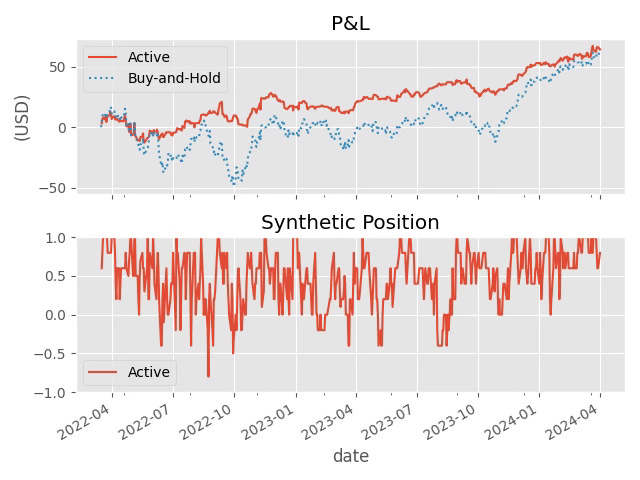
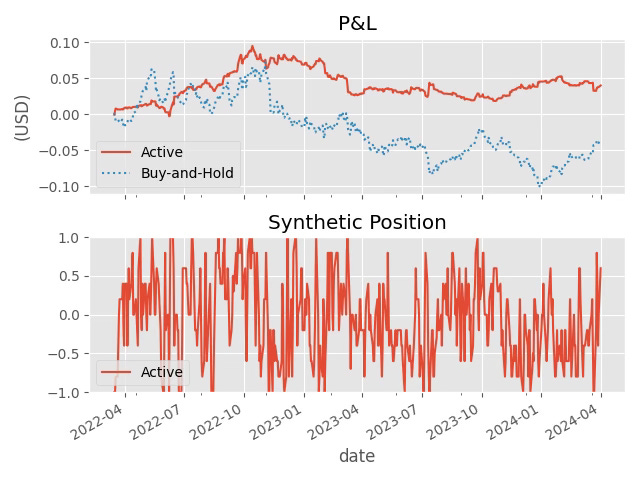
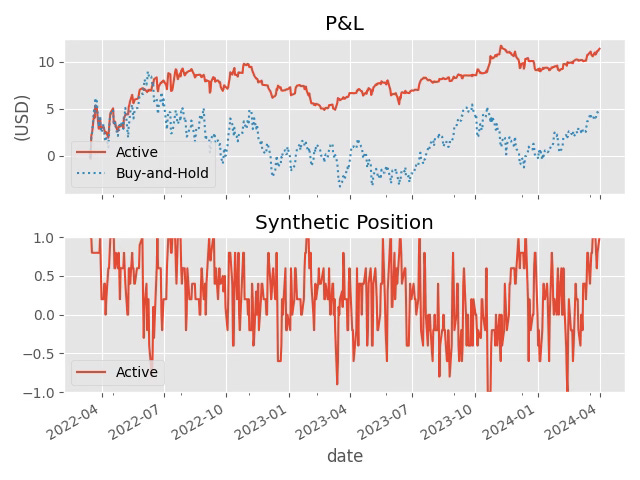
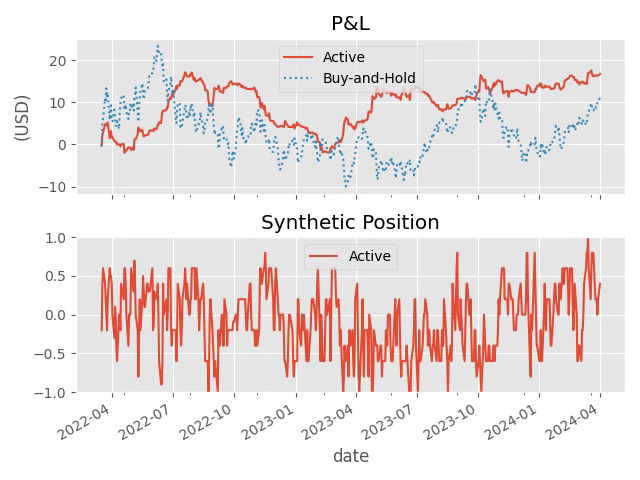
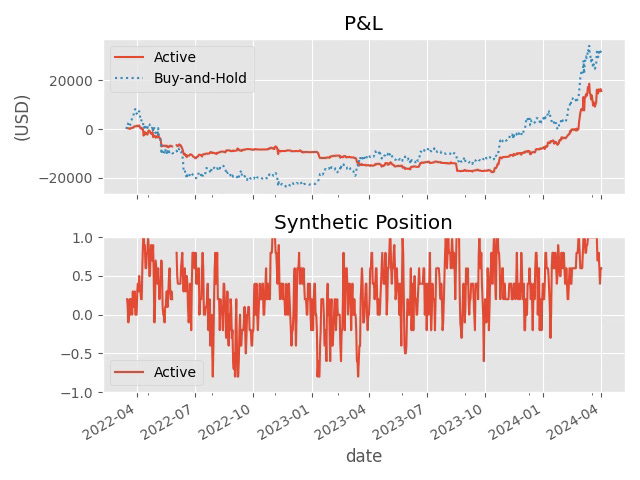
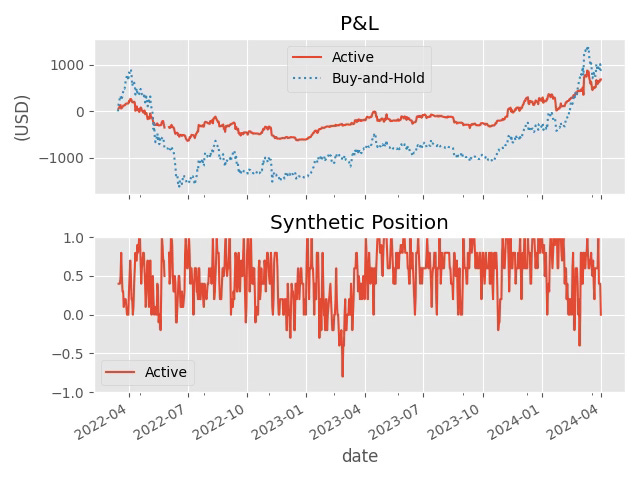
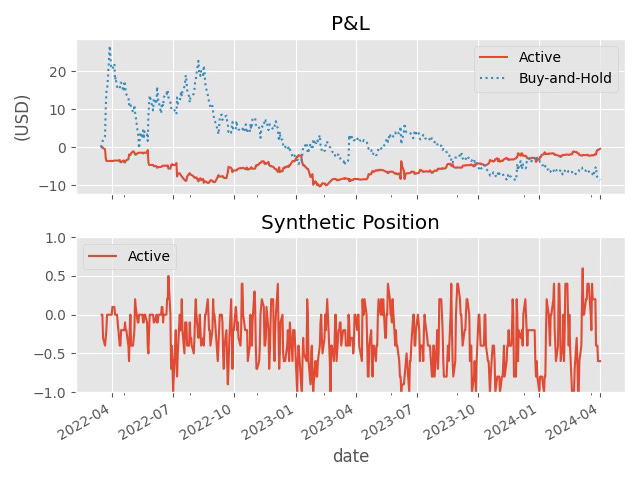
under this setting, we surveyed US stock indices, US single stocks, currencies, commodities, cryptocurrencies, and meme stocks. We will see over the past 24 months of live running record,
Passive buy-and-hold of US stock indices Nasdaq 100, S&P 500 ETFs QQQ, SPY was unbeaten by the active trading strategy
Passive buy-and-hold of Gold ETF GLD was unbeaten by the active trading strategy
Passive buy-and-hold of cryptocurrency Bitcoin BTCUSDT, Ethereum ETHUSDT was unbeaten by the active trading strategy
otherwise tsterm.com may help realise a better return vs max drop trade-off
The on-paper trading position generally appears with a lot of “zig-zag”. As explained in the white paper “backtest” section, the effective position for a single day is the average of two most recent trades, which is not a great number for average. If the forecast period were “180 days ahead”, the effective position for a single day would be the average of the most recent trades on last 180 days, appearing thus much smoother.
Equities
Apple AAPL.US
Microsoft MSFT.US
Nasdaq 100 ETF QQQ.US
S&P 500 ETF SPY.US
Dow Jones Industrial Average ETF DIA.US
Currencies
Swiss franc USDCHF
Gold ETF GLD.US
Silver ETF SLV.US
Commodities
Brent Crude Oil ETF BNO.US
WTI Crude Oil ETF USO.US
Cryptocurrencies
Bitcoin BTCUSDT
Ethereum ETHUSDT
Meme Stocks
GameStop GME.US
We will see the daily net prediction/on-paper position was averagely always negative even from 2023 when GME was buoyant.
AMC Theatres AMC.US


